Netflix
This page is designed to help users understand Netflix's content and how audiences engage with it. How do genres become popular or unpopular through time? Why do certain movies or shows thrive? What can be said about the world-wide streaming culture? These are all questions that can help users understand Netflix's consumer behavior and what content gains attention. In order to answer these questions, websites that have an extensive research on Netflix are optimal. This can range from Netflix itself (particularly consumer insights) to online platforms that gather large amounts of data on Netflix such as Statista.
Content Analytics
 Netflix Top 10
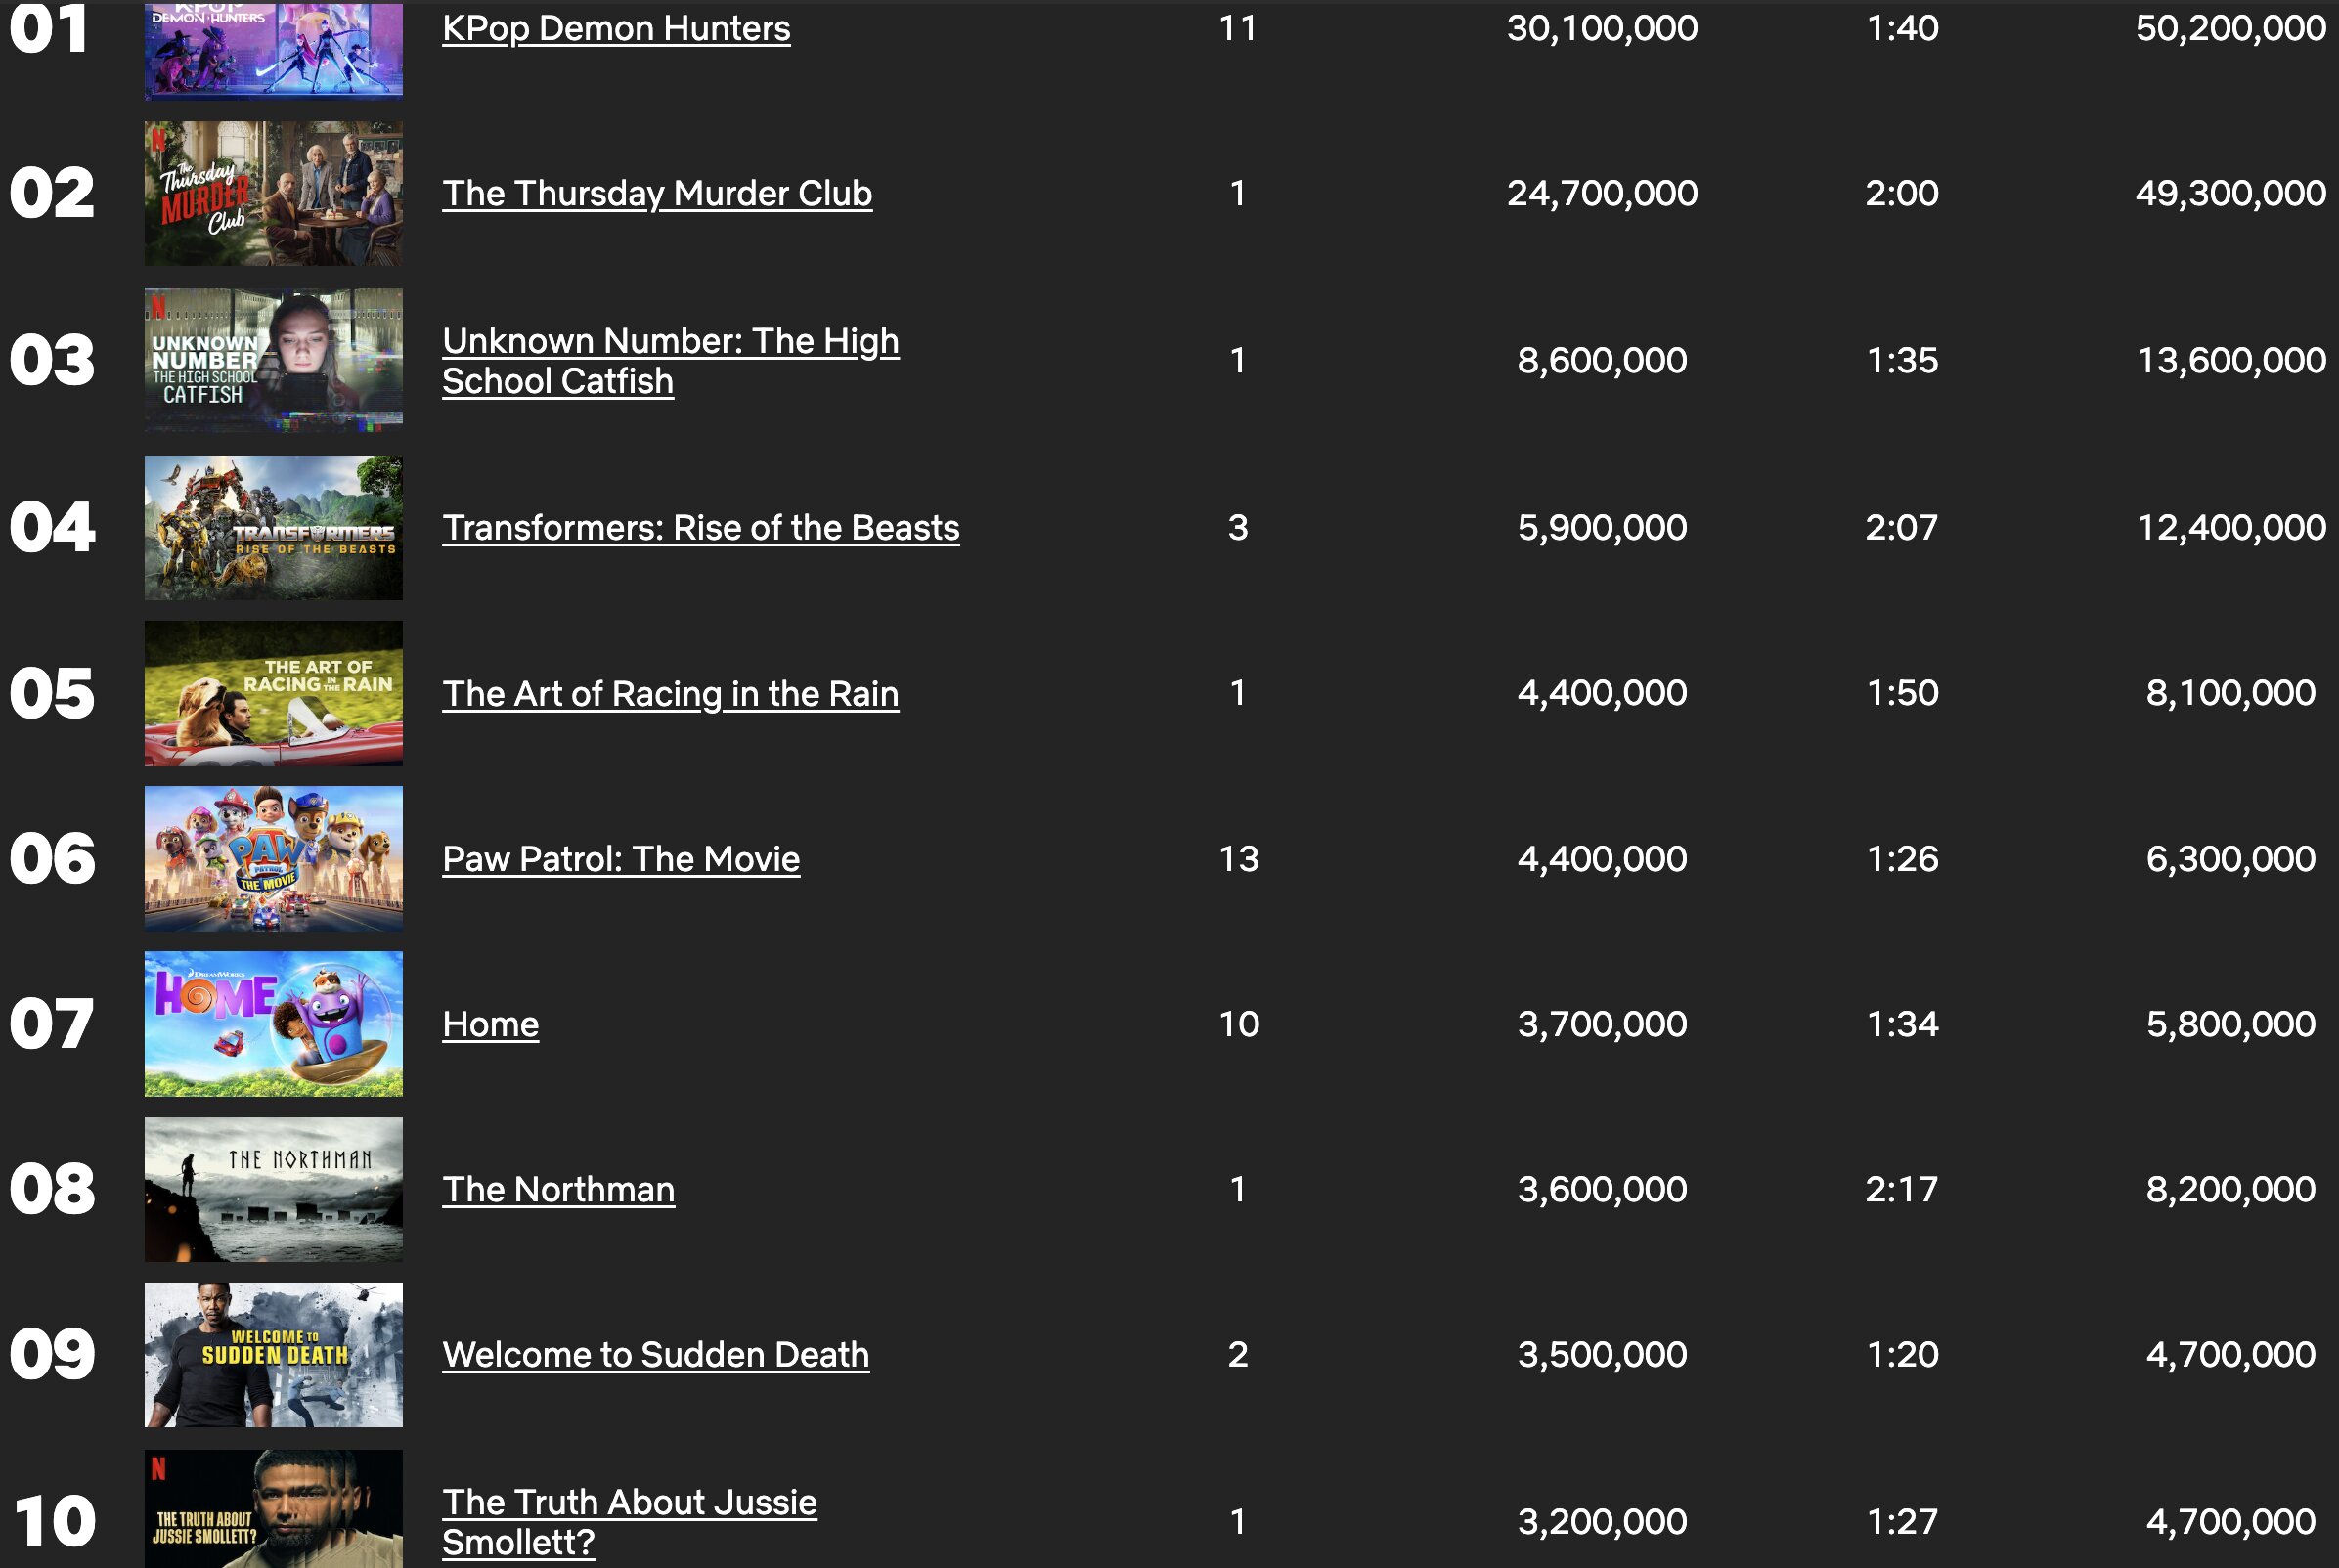
Netflix Top 10 shows the weekly global rankings allowing us to see what is most popular. It is on the site Tudum which was launched by Netflix to connect their content with fans. In the table the first column shows the rankings, the following one shows how many weeks the content has remained in the top 10, then the number of views, then the content's runtime, and finally on the last column we have the amount of hours the content has been viewed for. At number 1 we have Kpop Demon Hunters that follows its 11th week in the top 10 rankings. At number 2 we have The Thursday Murder Club which appears to be a relatively new interest. This type of data allows users to recognize a long-term success such as Kpop Demon Hunters in comparison to short-lived hypes such as The Thursday Murder Club. This type of data allows users to see what is currently trending worlwide on Netflix. Out of the trends, we can see viewer engagement with each content. This can allow us to track patterns over time wherefore we can anticipate what types of content are likely to be successful.
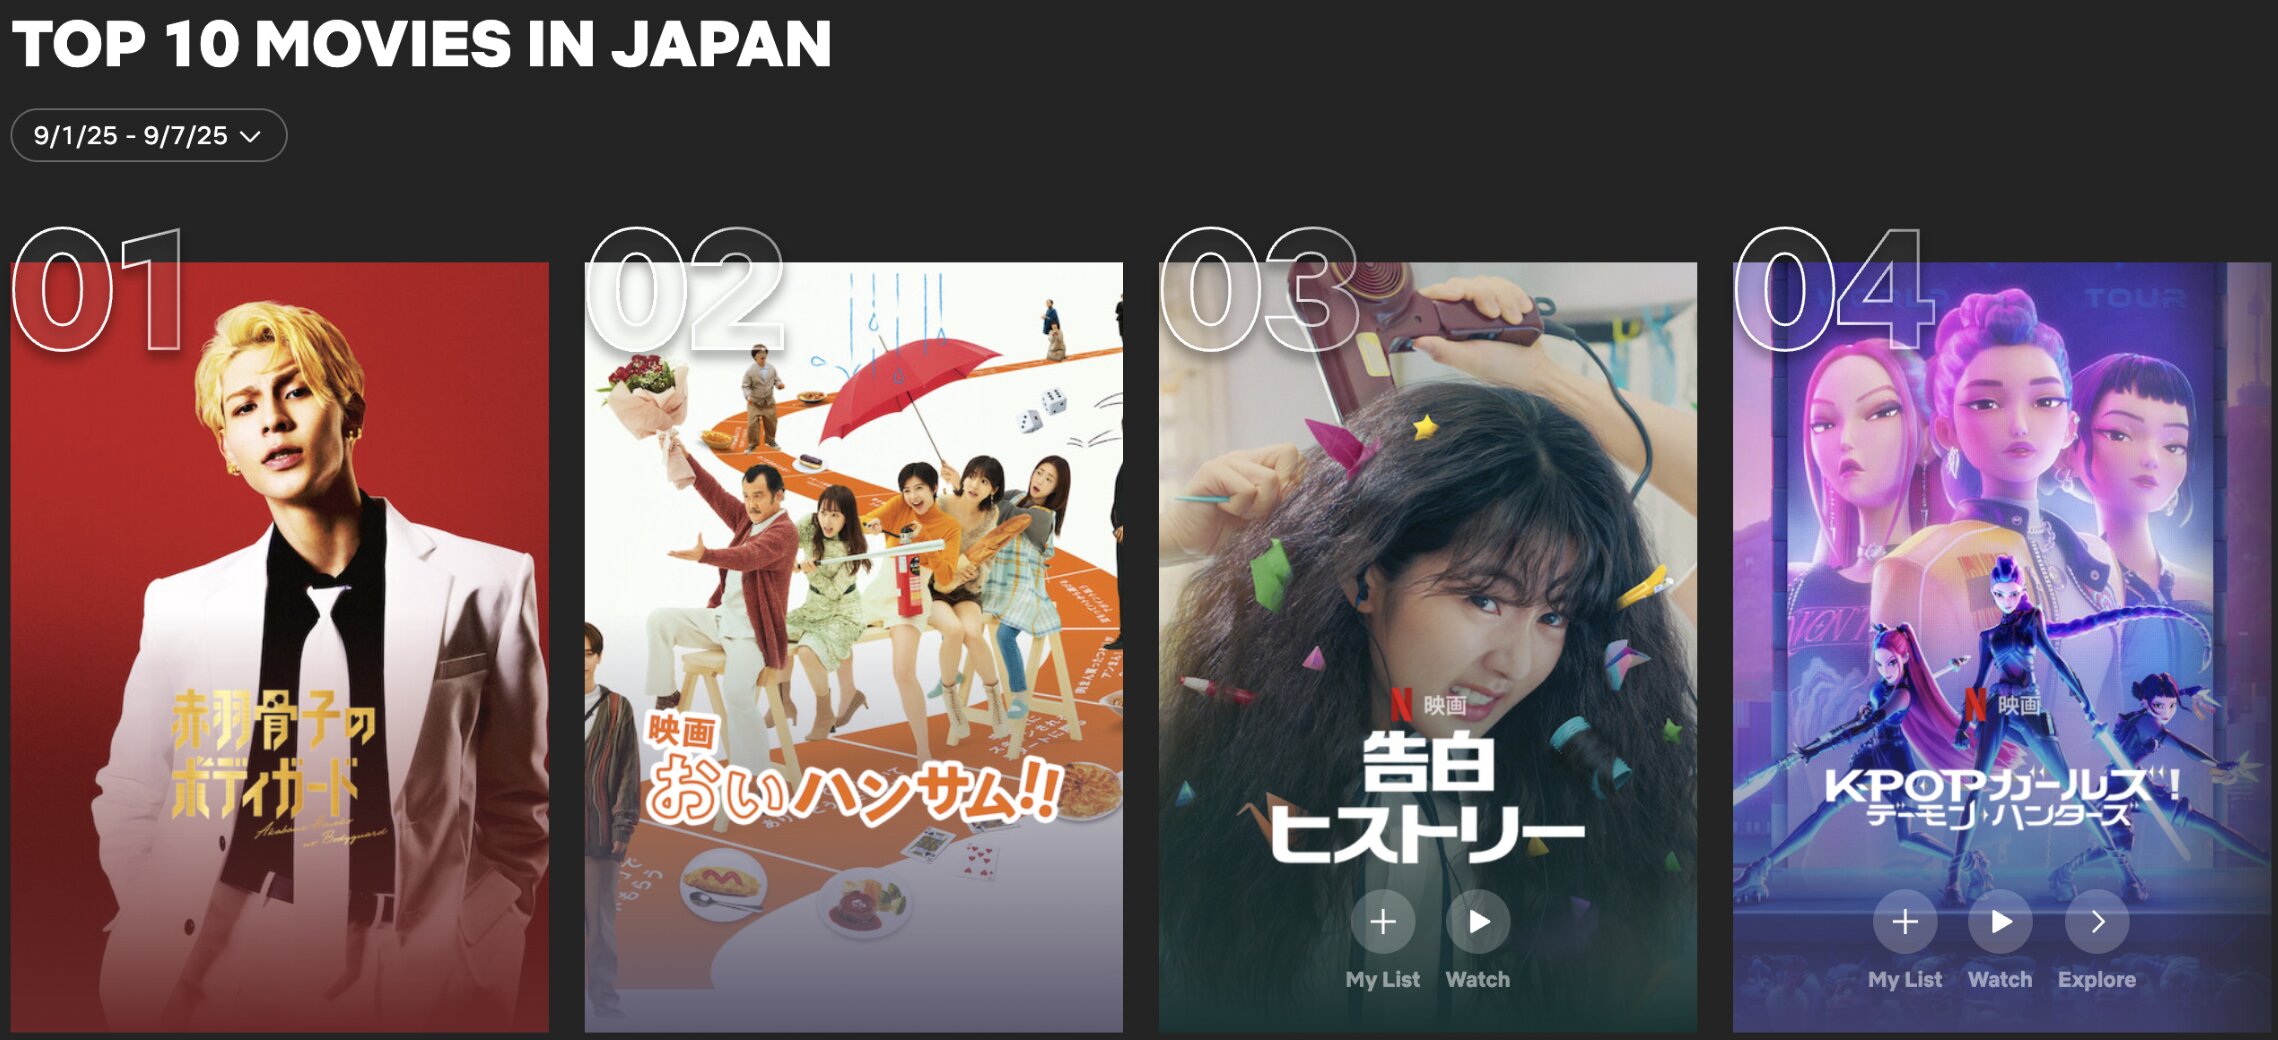
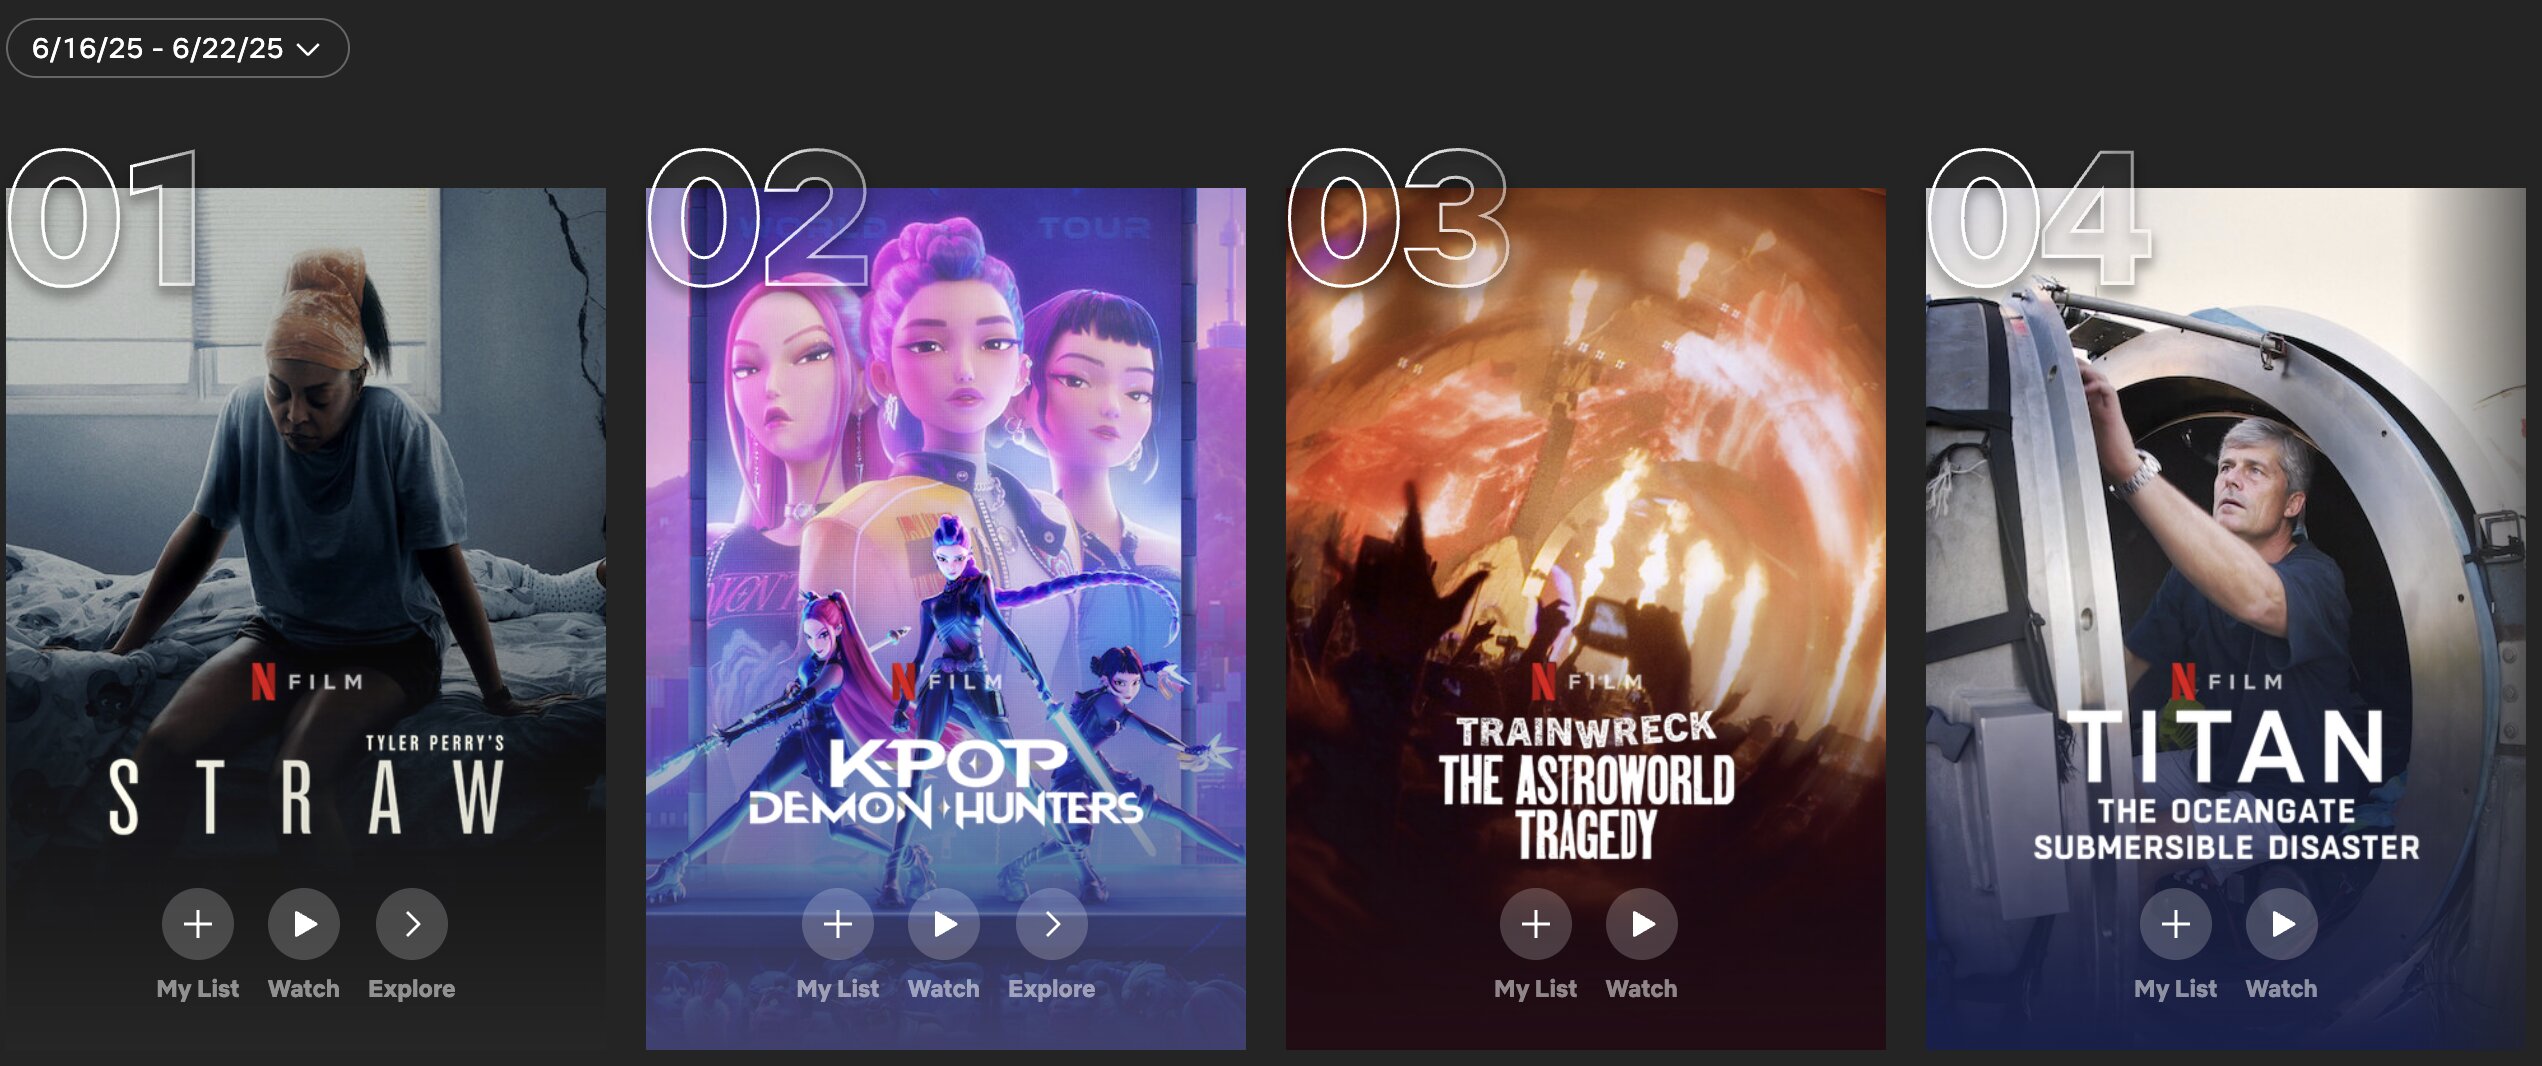
YOU who are viewing this page, start by clicking on "Top 10 Movies on Netflix Right Now" and click on the dropdown menu to change regions. Click through the different regions, to see how the content popularity shifts with different locations. For example, althrough regions such as the US and Brazil may have similair titles in the top ranks, India and Japan, on the other hand, differ greatly. Japan in specific, can be seen in the image "Top movies in Japan", notice how the popular movies are different to those under Netflix Top 10 globally. Next, there's another dropdown menu but to change dates, click through the different dates to see how the trending content changes through time or what maintains through long periods. For example, in the image "Top movies in June 16-22, 2025", we can see how Kpop Demon Hunters was still popular back then as it is now, reinforcing the idea that it is a long-term success.
 FlixPatrol
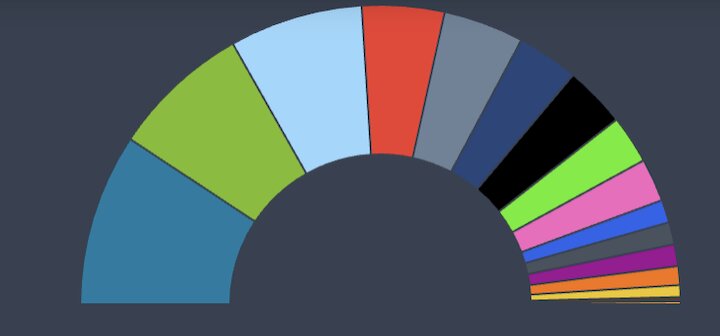
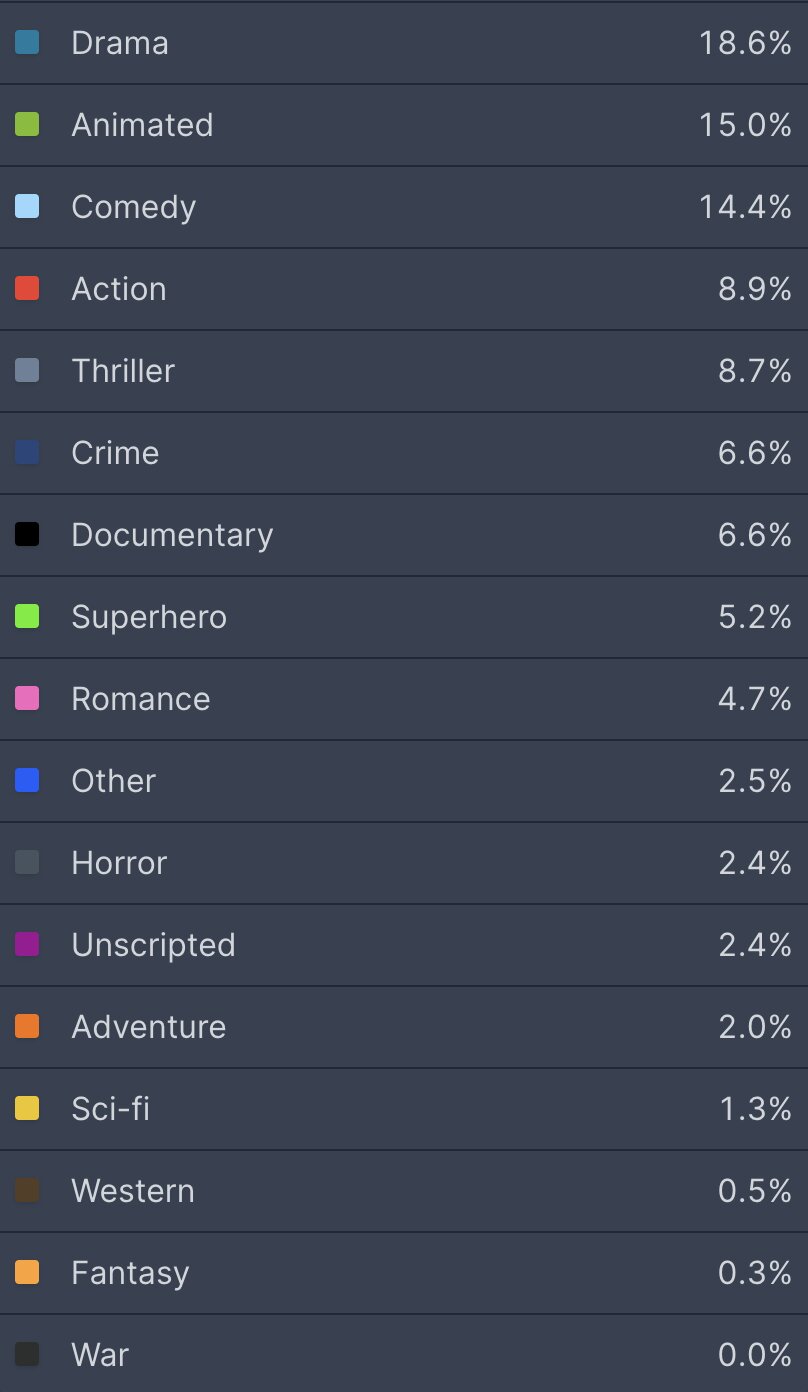
FlixPatrol shows the genre preferences of Netflix's consumers. Specific to the graph on the left, FlixPatrol presents such preferences for quarter 3 of 2025. The most popular genre globally being drama at 18.6% and following that, animated at 15%. This helps users to understand what content is currently more appealing to Netflix's viewers. This can also provide some insight onto which genres Netflix will prioritize (particularly usefull for movie producers and filmmakers). Additionally, users can identify growing trends such as animated that has been very popular in Japan and now is gaining interest globally.
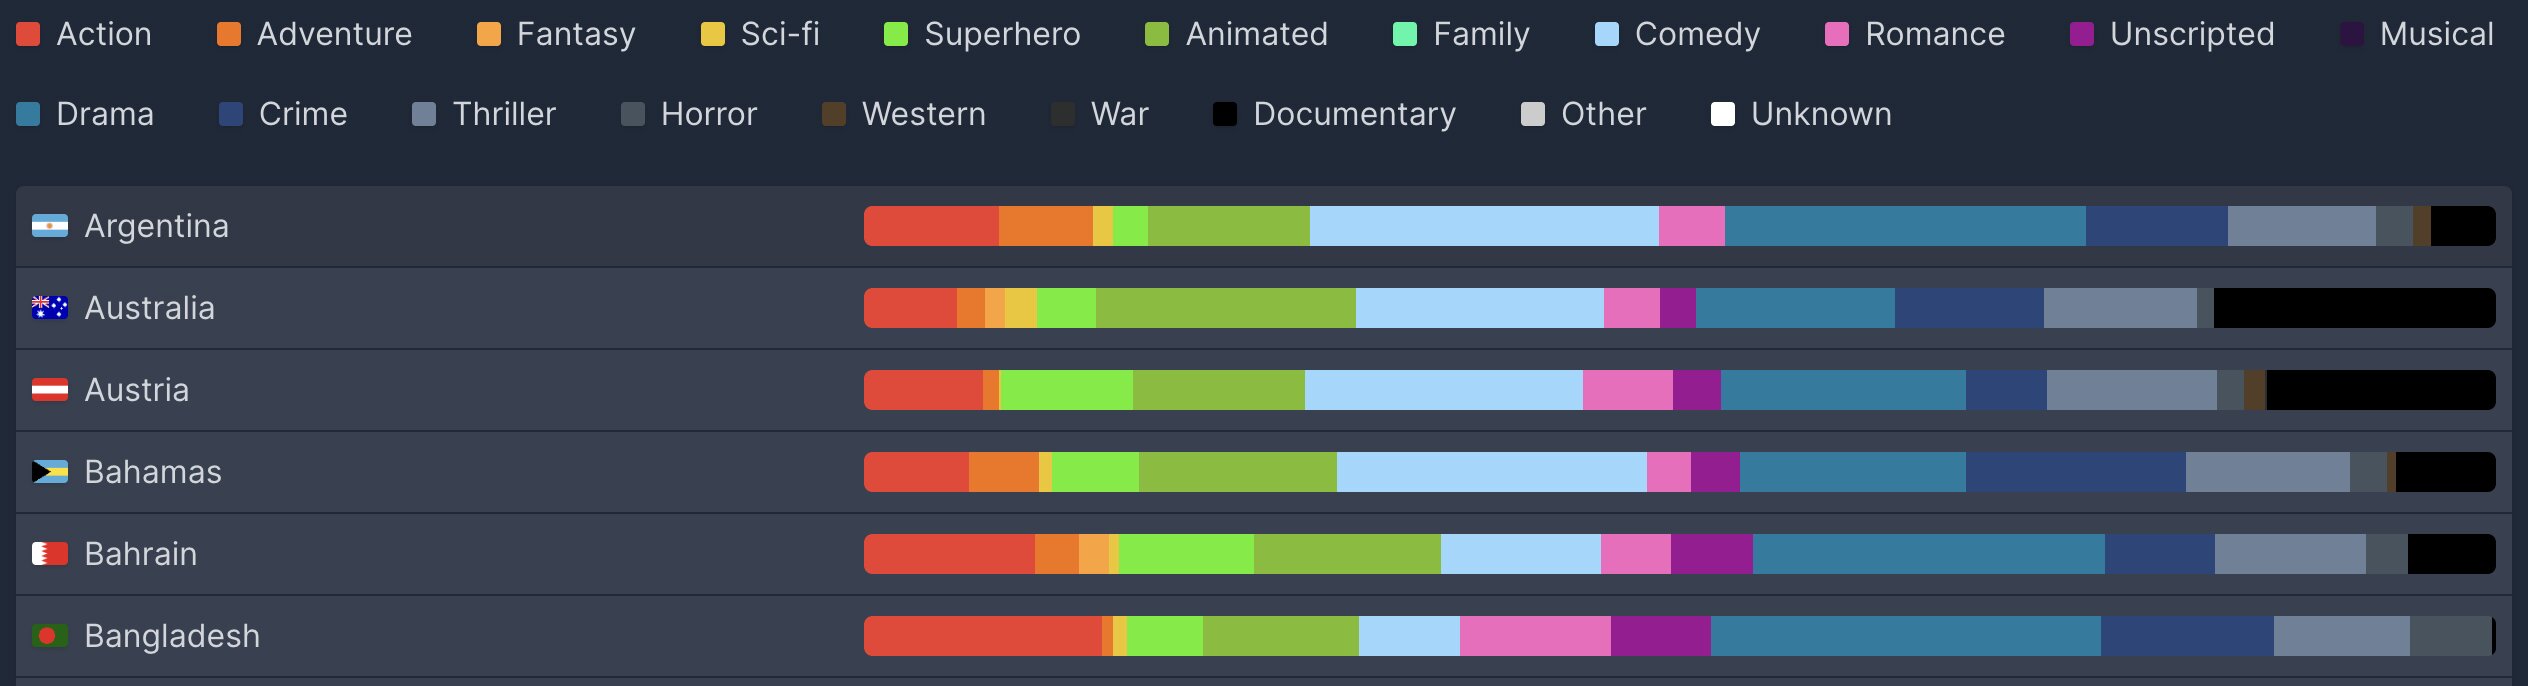
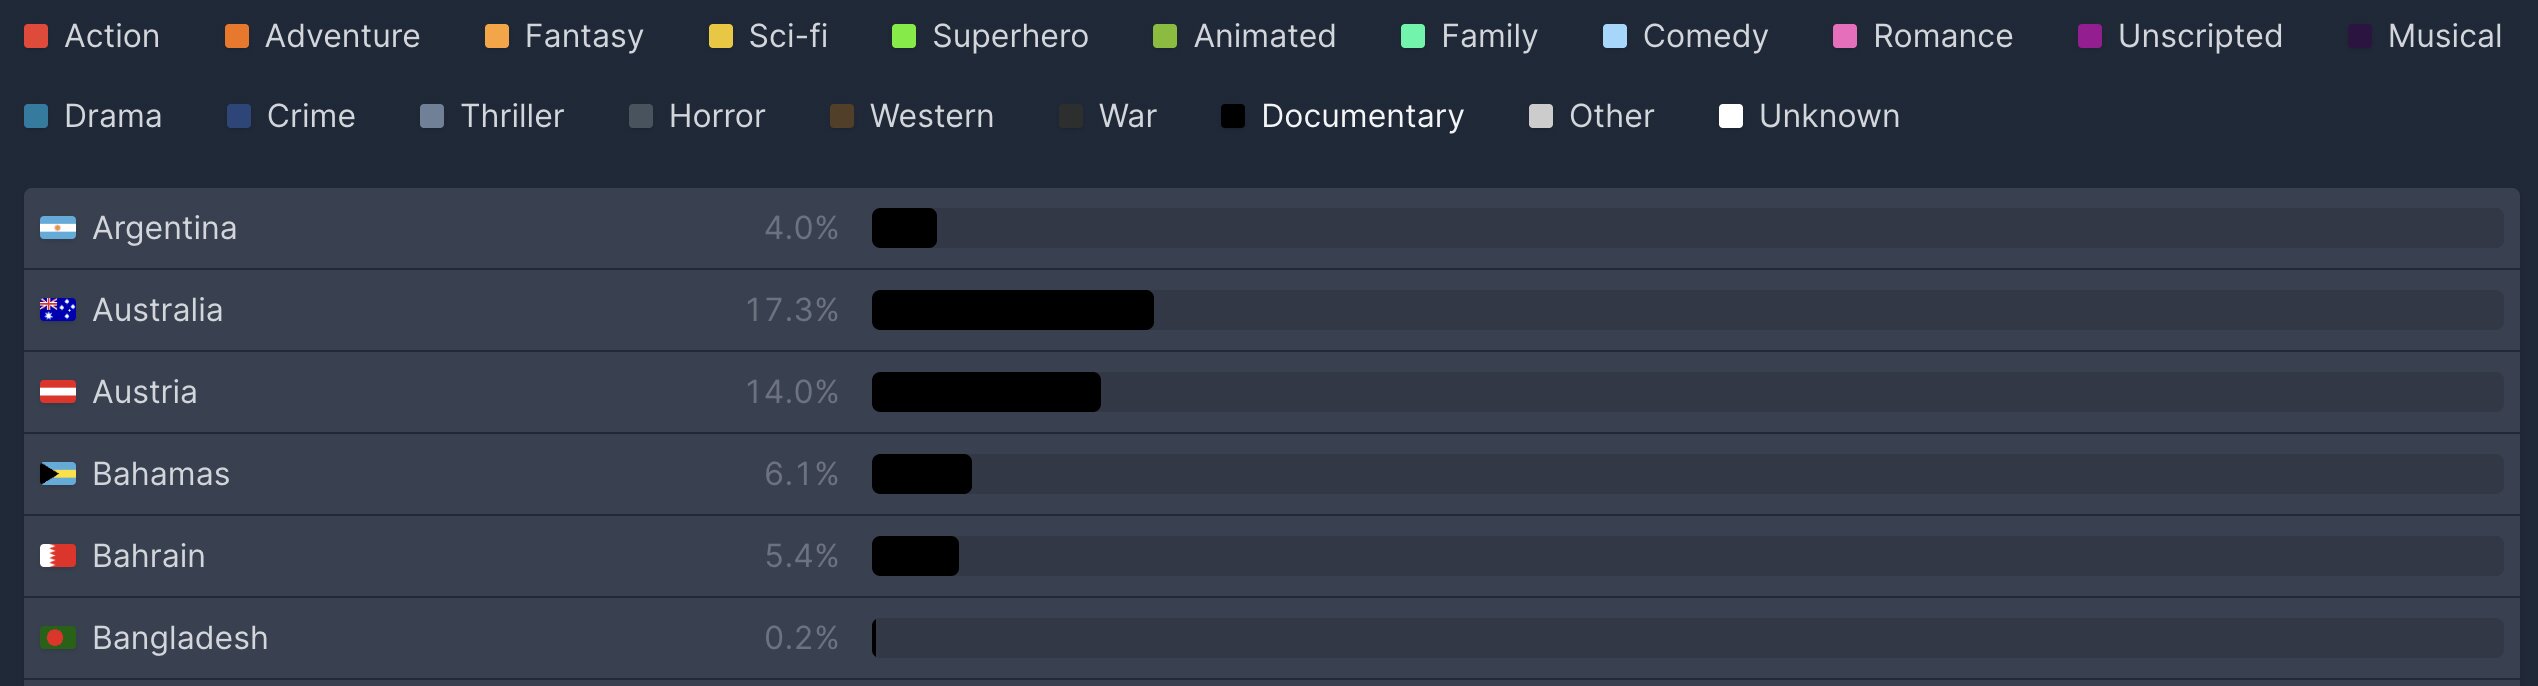
Following YOUR journey on this webpage, click on "Preferences on Netflix in Q3 2025" and click on the By movie or TV genre link. As you scroll down, you'll see how the popularity of certain genres may shift between regions. For example, taking a look at the image "Preferences of genres per region" in Bangladesh, very few customers watch documentaries in contrast to Australia where documentaries are much more popular. Then, theres a dropdown menu to specify the genre you want to look at. As shown in the image "Preferences of documentaries per region", by clicking documentary, you can see the exact percentage of the genre's popularity. Here we can see that there's a contrast of 0.2% for documentary in Bangladesh versus 17.3% in Australia. This allows us to see the different tastes across regions. Netflix for one, can spot strategic opportunities to increase or decrease the production of genres in certain regions.
 Netflix
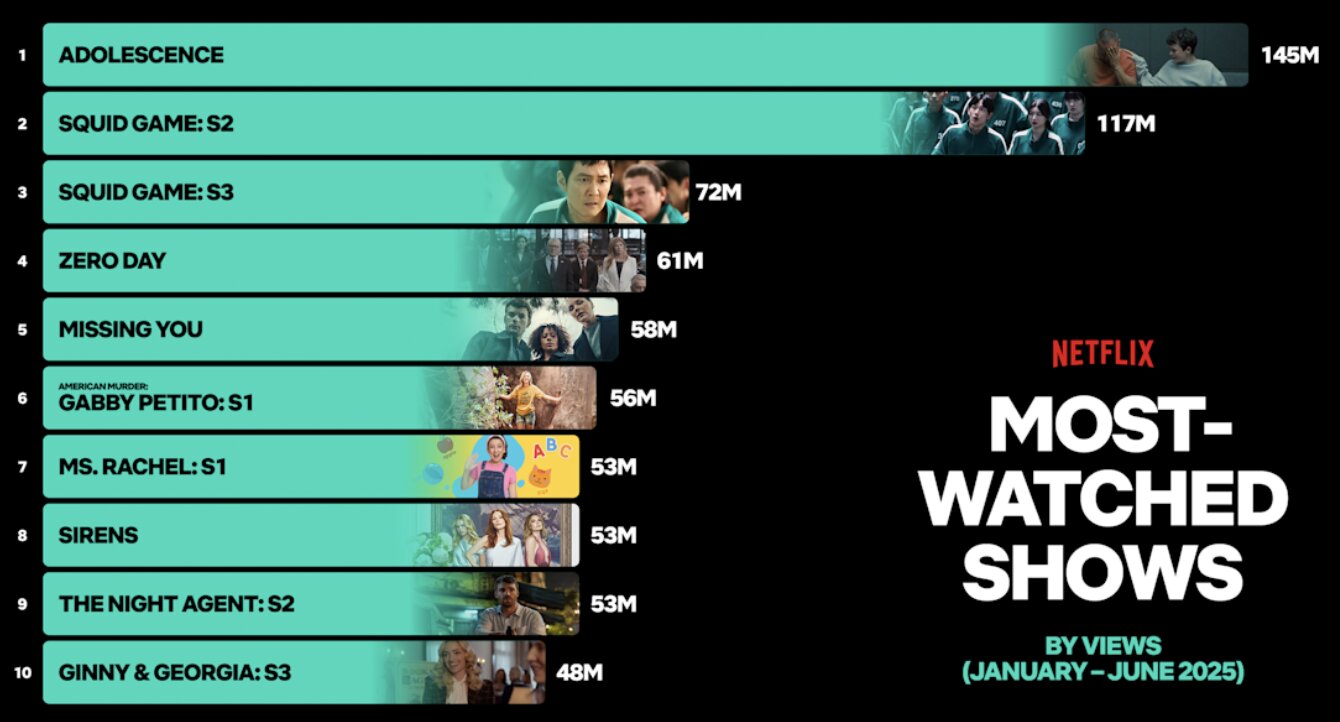
Netflix's What We Watched Engagement Report shows what Netflix customer dedicate their time to. It is released 2 times a year covering the content over every 6 months. The bar graph on the right shows the most-watched shows and their total hours viewed. Here we can see that Adolescence is the most-watched show of the first semester of 2025, reaching a total of 145 million hours viewed. Next up is Squid Game: S2 with a total of 117 million views. This helps users understand what customers commit to long-term rather than understaning just what is trending. Adolescence is therefore a show that customers commit to for months and will likely continue to be popular as people recommend it.
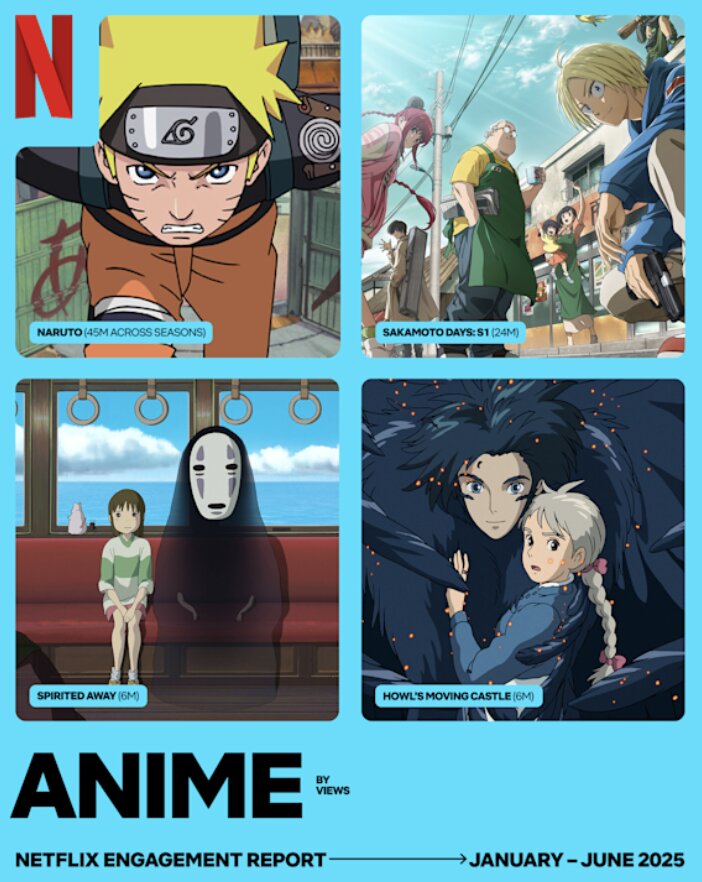
The final thing YOU can do is click on "What We Watched the First Half of 2025" and scroll through the report to find what customers dedicate their time to throughout different genres. For example, in the image "Most-watched anime Janurary-June, 2025", Naruto is number 1 for anime at 45 millions hours viewed across all seasons. This type of data shows what audiences may look for in specific genres. This can help both Netflix and filmmakers decide on what to invest in next. It can also serve as a great indicator of what customers should watch as long-term audience commitment suggests entertainment and satsifaction with the content. Netflix can also understand what is providing them more revenue and what isn't.
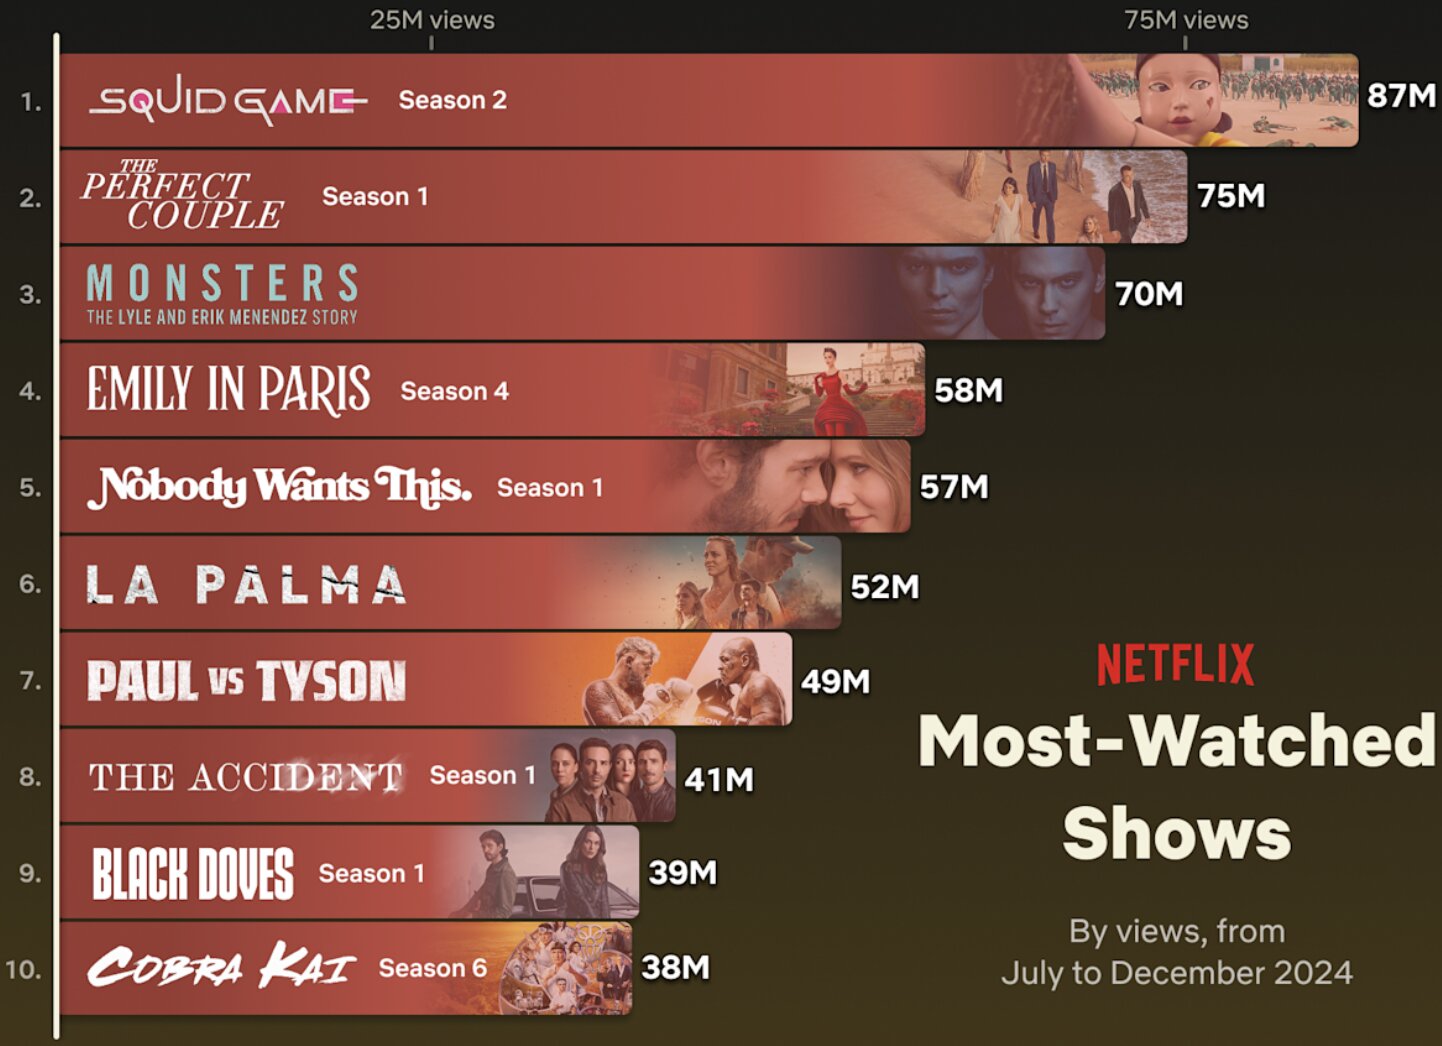
What YOU can do next is click on the Newsroom tab, find the search bar and type in "What We Watched". This will bring up several previous reports of other semesters in other years. An example is the "What We Watched the Second Half of 2024" report. The image "Most-watched shows July-December, 2024" shows what Netflix customers have been watching long-term. You can compare this with the following report in 2025 and find that Squid Game: S2 has gained a tremendous amount of hours viewed over both reports. This reveals what shows grow their audiences overtime and which ones fade.