Insights From Shark Tank Data
We don't guess — we analyze patterns behind 1,440+ real deals.
Industry Performance Overview
| Industry | Total Pitches | Deals Made | Success Rate (%) | Avg Deal Size ($) | Avg Viewership (M) |
|---|---|---|---|---|---|
| Food and Beverage | 309 | 188 | 60.84 | $189,971 | 4.87 |
| Lifestyle/Home | 257 | 173 | 67.32 | $159,195 | 4.76 |
| Fashion/Beauty | 235 | 134 | 57.02 | $131,074 | 5.07 |
| Fitness/Sports/Outdoors | 146 | 93 | 63.70 | $193,116 | 4.77 |
| Children/Education | 133 | 87 | 65.41 | $142,080 | 5.21 |
| Health/Wellness | 67 | 40 | 59.70 | $278,582 | 4.68 |
| Technology/Software | 69 | 38 | 55.07 | $178,043 | 5.34 |
| Pet Products | 61 | 34 | 55.74 | $131,131 | 4.90 |
| Business Services | 42 | 22 | 52.38 | $177,976 | 4.17 |
| Media/Entertainment | 28 | 18 | 64.29 | $268,750 | 5.10 |
| Uncertain/Other | 23 | 15 | 65.22 | $238,696 | 4.22 |
| Automotive | 17 | 13 | 76.47 | $321,471 | 4.75 |
| Electronics | 18 | 9 | 50.00 | $172,444 | 4.90 |
| Green/CleanTech | 14 | 7 | 50.00 | $153,571 | 5.21 |
Complete industry breakdown across all 1,440 Shark Tank pitches (Seasons 1-16)
Market Share Distribution
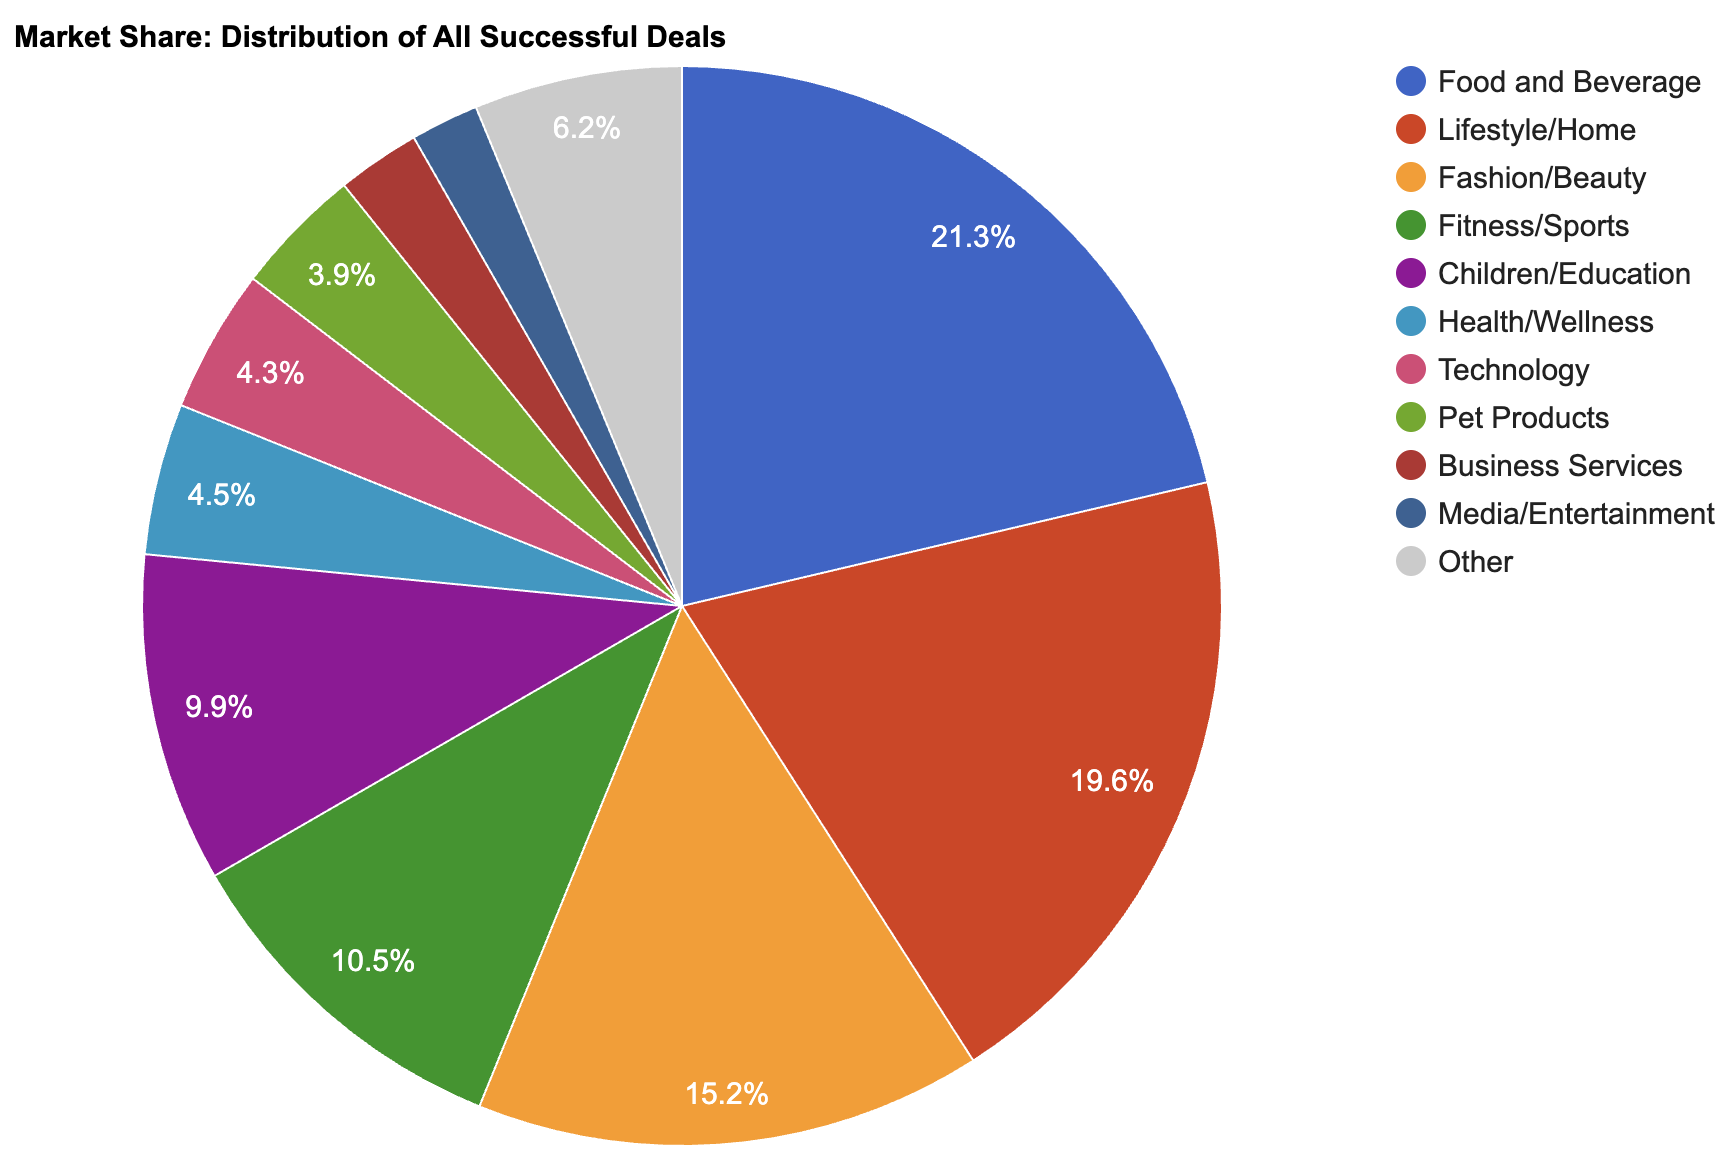
Key Insights:
- Market Dominance: Top 3 industries account for over 45% of all pitches
- Emerging Categories: Health/Wellness and Technology sectors show growing representation
- Niche industries (Automotive, Green/Clean Tech) remain underrepresented at less than 5%
Industry Deal Conversion Rates
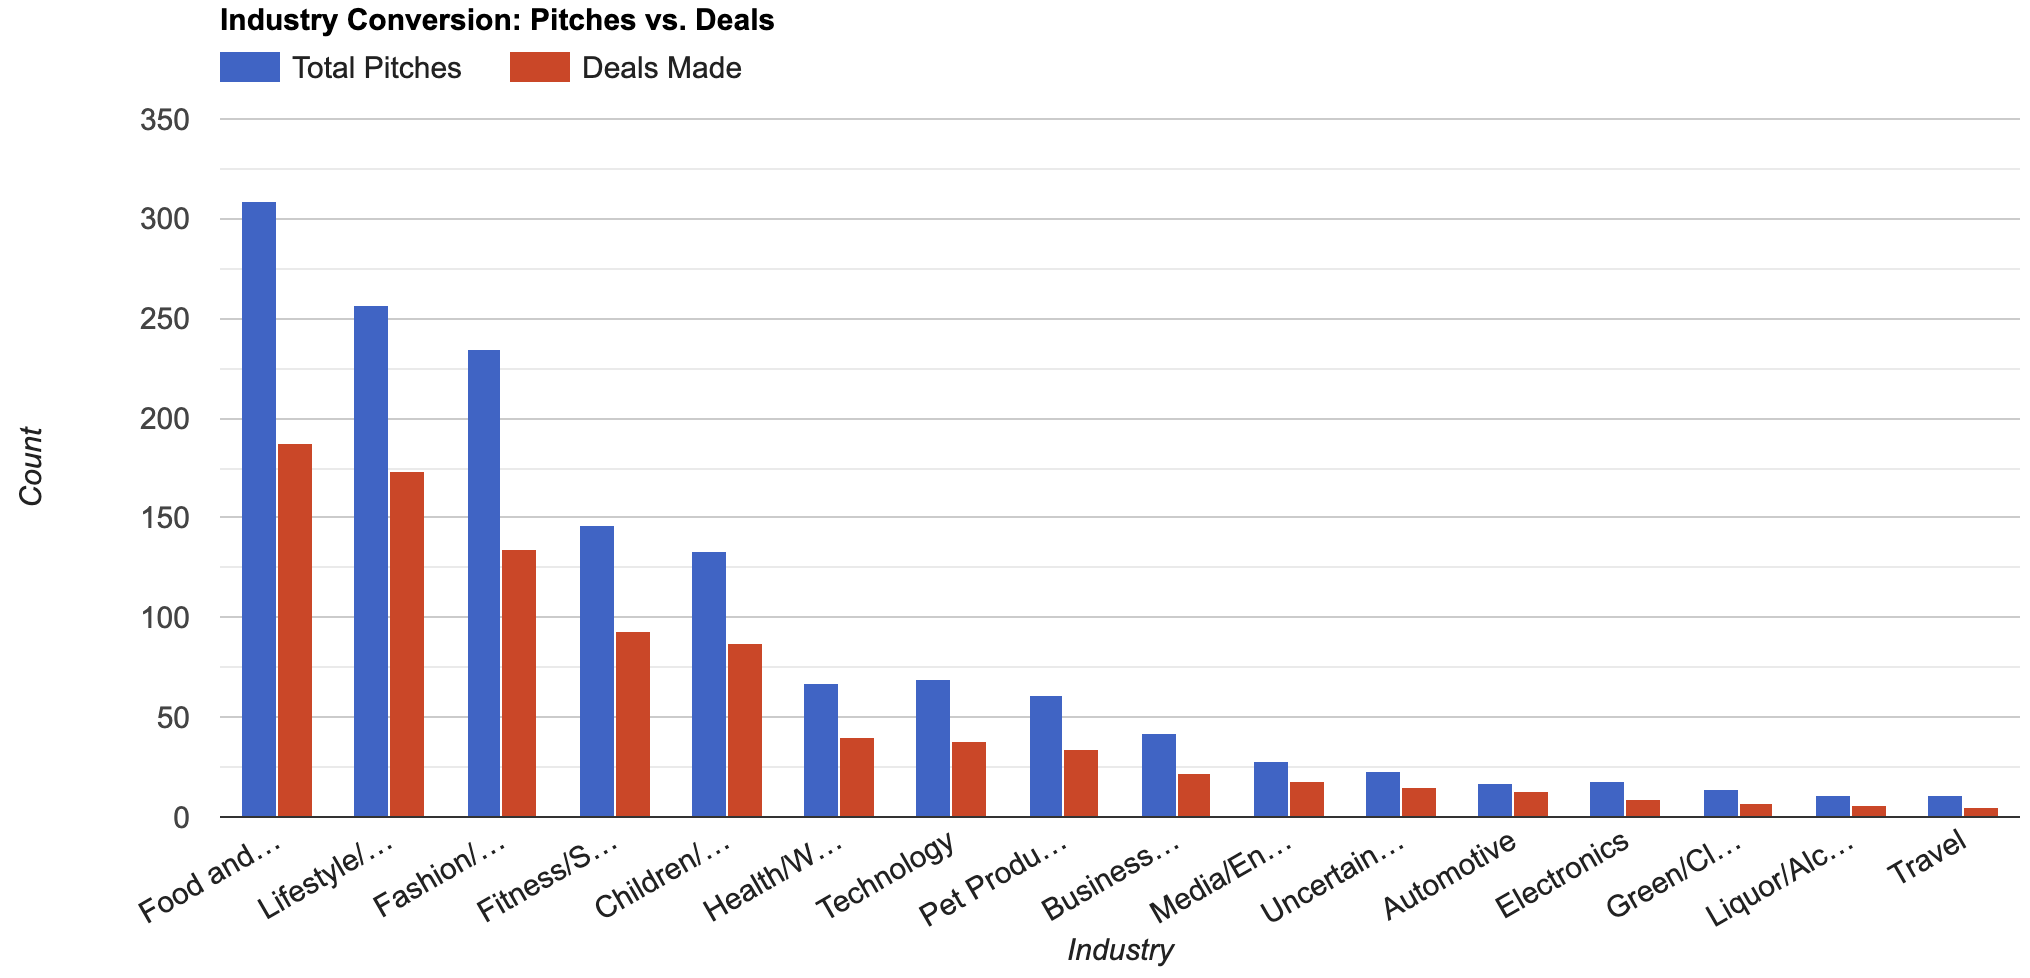
Key Insights:
- Winner Category: Food & Beverage leads with 58% conversion rate
- Tough Market: Automotive and Green/Clean Tech struggle below 35% success
- Established categories (Fashion, Lifestyle) maintain steady 45-50% conversion
Average Deal Amount by Industry
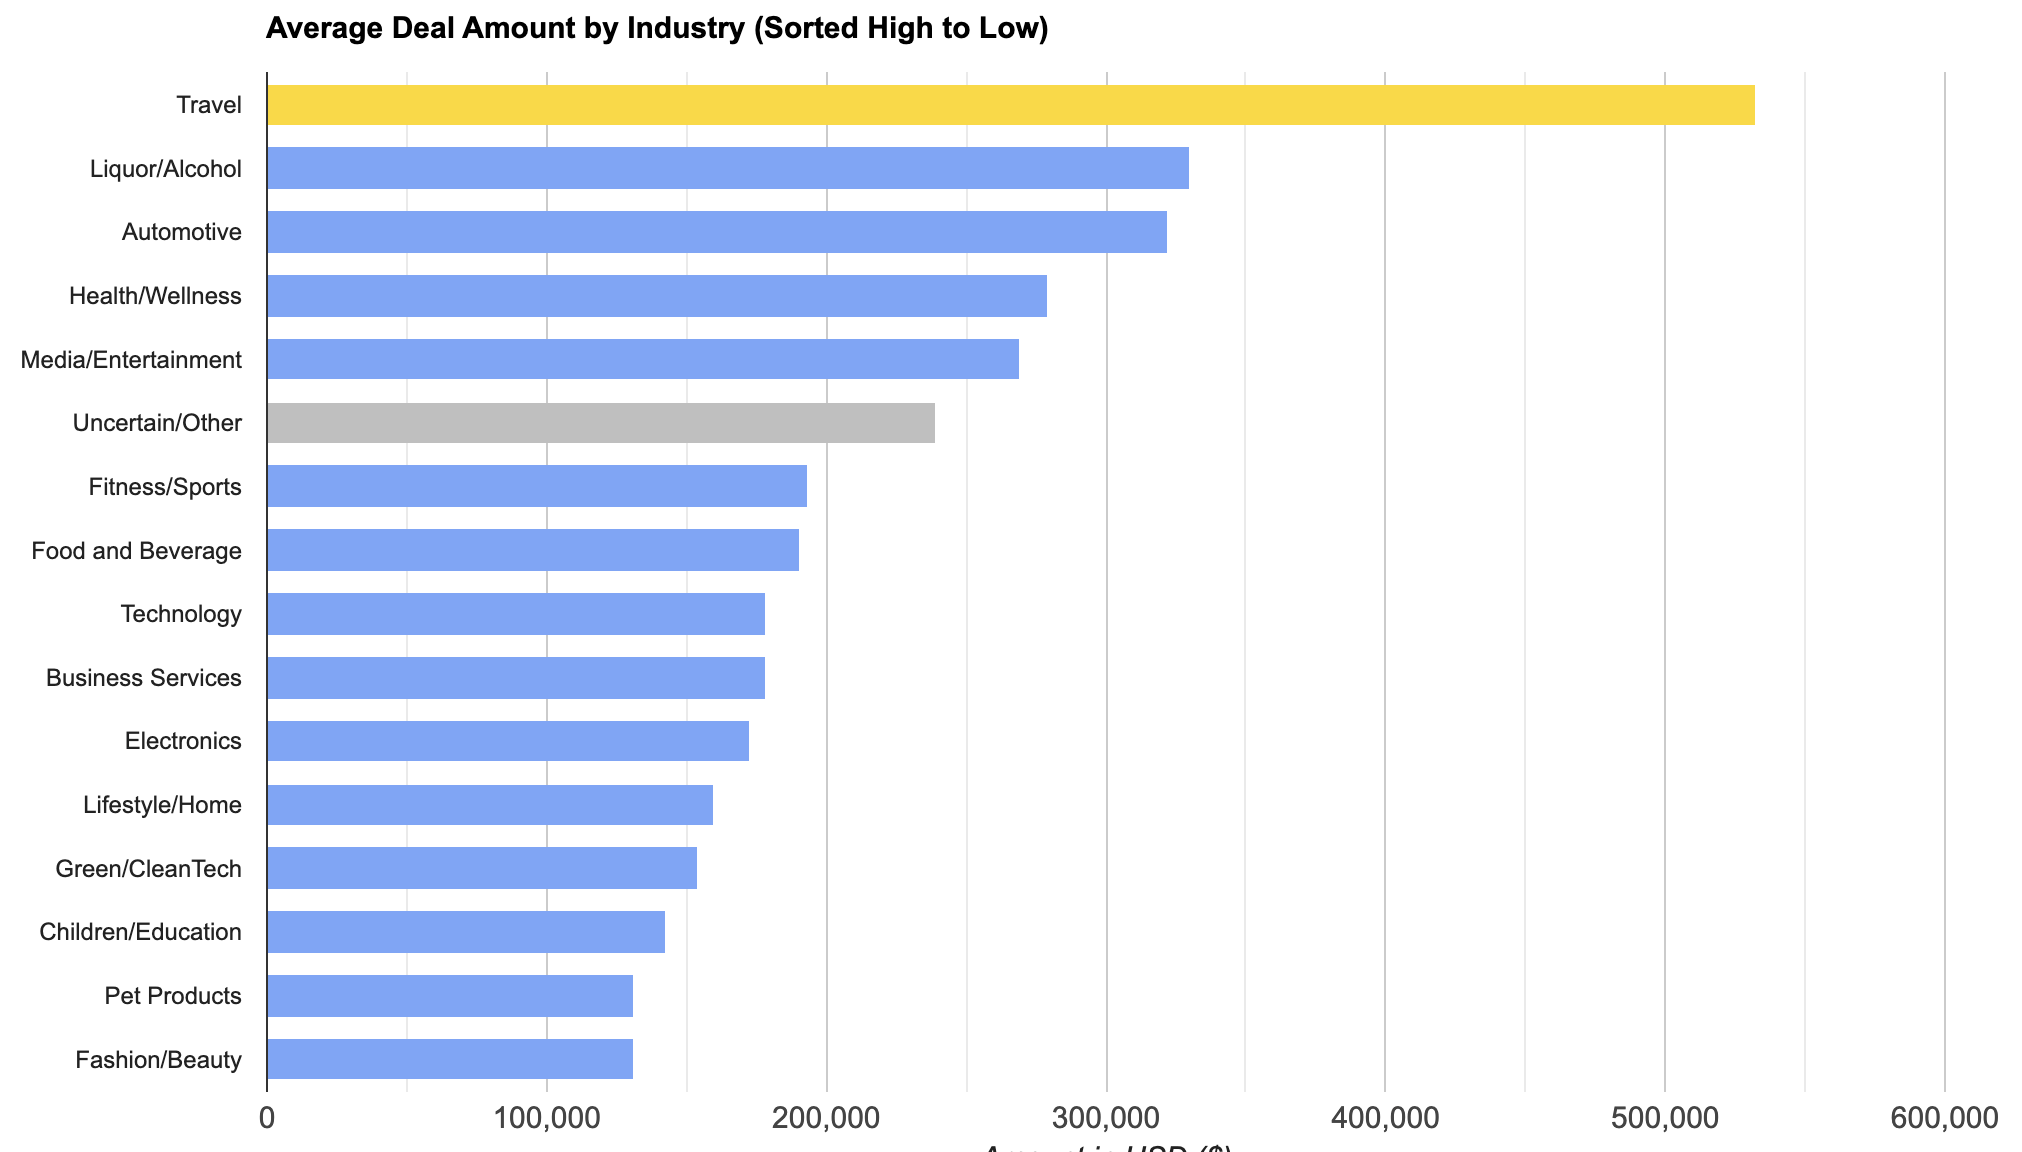
Key Insights:
- Premium Sectors: Technology/Software averages $285K per deal vs. $178K overall
- Entry-Level Industries: Fashion/Beauty and Children's products average $120K-145K
- High capital requirement industries (Automotive, Manufacturing) average $310K+ per deal
Industry-Level & Deal Outcome Overview
| Industry | Original Ask Amount | Original Offered Equity | Valuation Requested | Got Deal | Total Deal Amount | Total Deal Equity | Deal Valuation |
|---|---|---|---|---|---|---|---|
| Health/Wellness | $50,000 | 15% | $333,333 | Yes | $50,000 | 55% | $90,909 |
| Food and Beverage | $460,000 | 10% | $4,600,000 | Yes | $460,000 | 50% | $920,000 |
| Business Services | $1,200,000 | 10% | $12,000,000 | No | — | — | — |
| Lifestyle/Home | $250,000 | 25% | $1,000,000 | No | — | — | — |
| Technology/Software | $1,000,000 | 15% | $6,666,667 | No | — | — | — |
| Food and Beverage | $500,000 | 15% | $3,333,333 | Yes | $500,000 | 50% | $1,000,000 |
| Children/Education | $250,000 | 10% | $2,500,000 | Yes | $250,000 | 100% | $250,000 |
| Automotive | $500,000 | 10% | $5,000,000 | No | — | — | — |
| Fashion/Beauty | $200,000 | 20% | $1,000,000 | No | — | — | — |
| Lifestyle/Home | $100,000 | 20% | $500,000 | No | — | — | — |
| Food and Beverage | $35,000 | 35% | $100,000 | Yes | $35,000 | 100% | $35,000 |
| Children/Education | $250,000 | 20% | $1,250,000 | Yes | $250,000 | 50% | $500,000 |
| Children/Education | $100,000 | 10% | $1,000,000 | No | — | — | — |
| Children/Education | $155,000 | 10% | $1,550,000 | No | — | — | — |
| Media/Entertainment | $500,000 | 5% | $10,000,000 | No | — | — | — |
| Technology/Software | $150,000 | 30% | $500,000 | Yes | $200,000 | 50% | $400,000 |
| Children/Education | $350,000 | 15% | $2,333,333 | Yes | $35,000 | 40% | $87,500 |
| Business Services | $350,000 | 15% | $2,333,333 | No | — | — | — |
| Fashion/Beauty | $150,000 | 25% | $600,000 | No | — | — | — |
| Food and Beverage | $300,000 | 40% | $750,000 | No | — | — | — |
Sample of 20 pitches showing deal outcomes and valuation dynamics
Industry Word Cloud
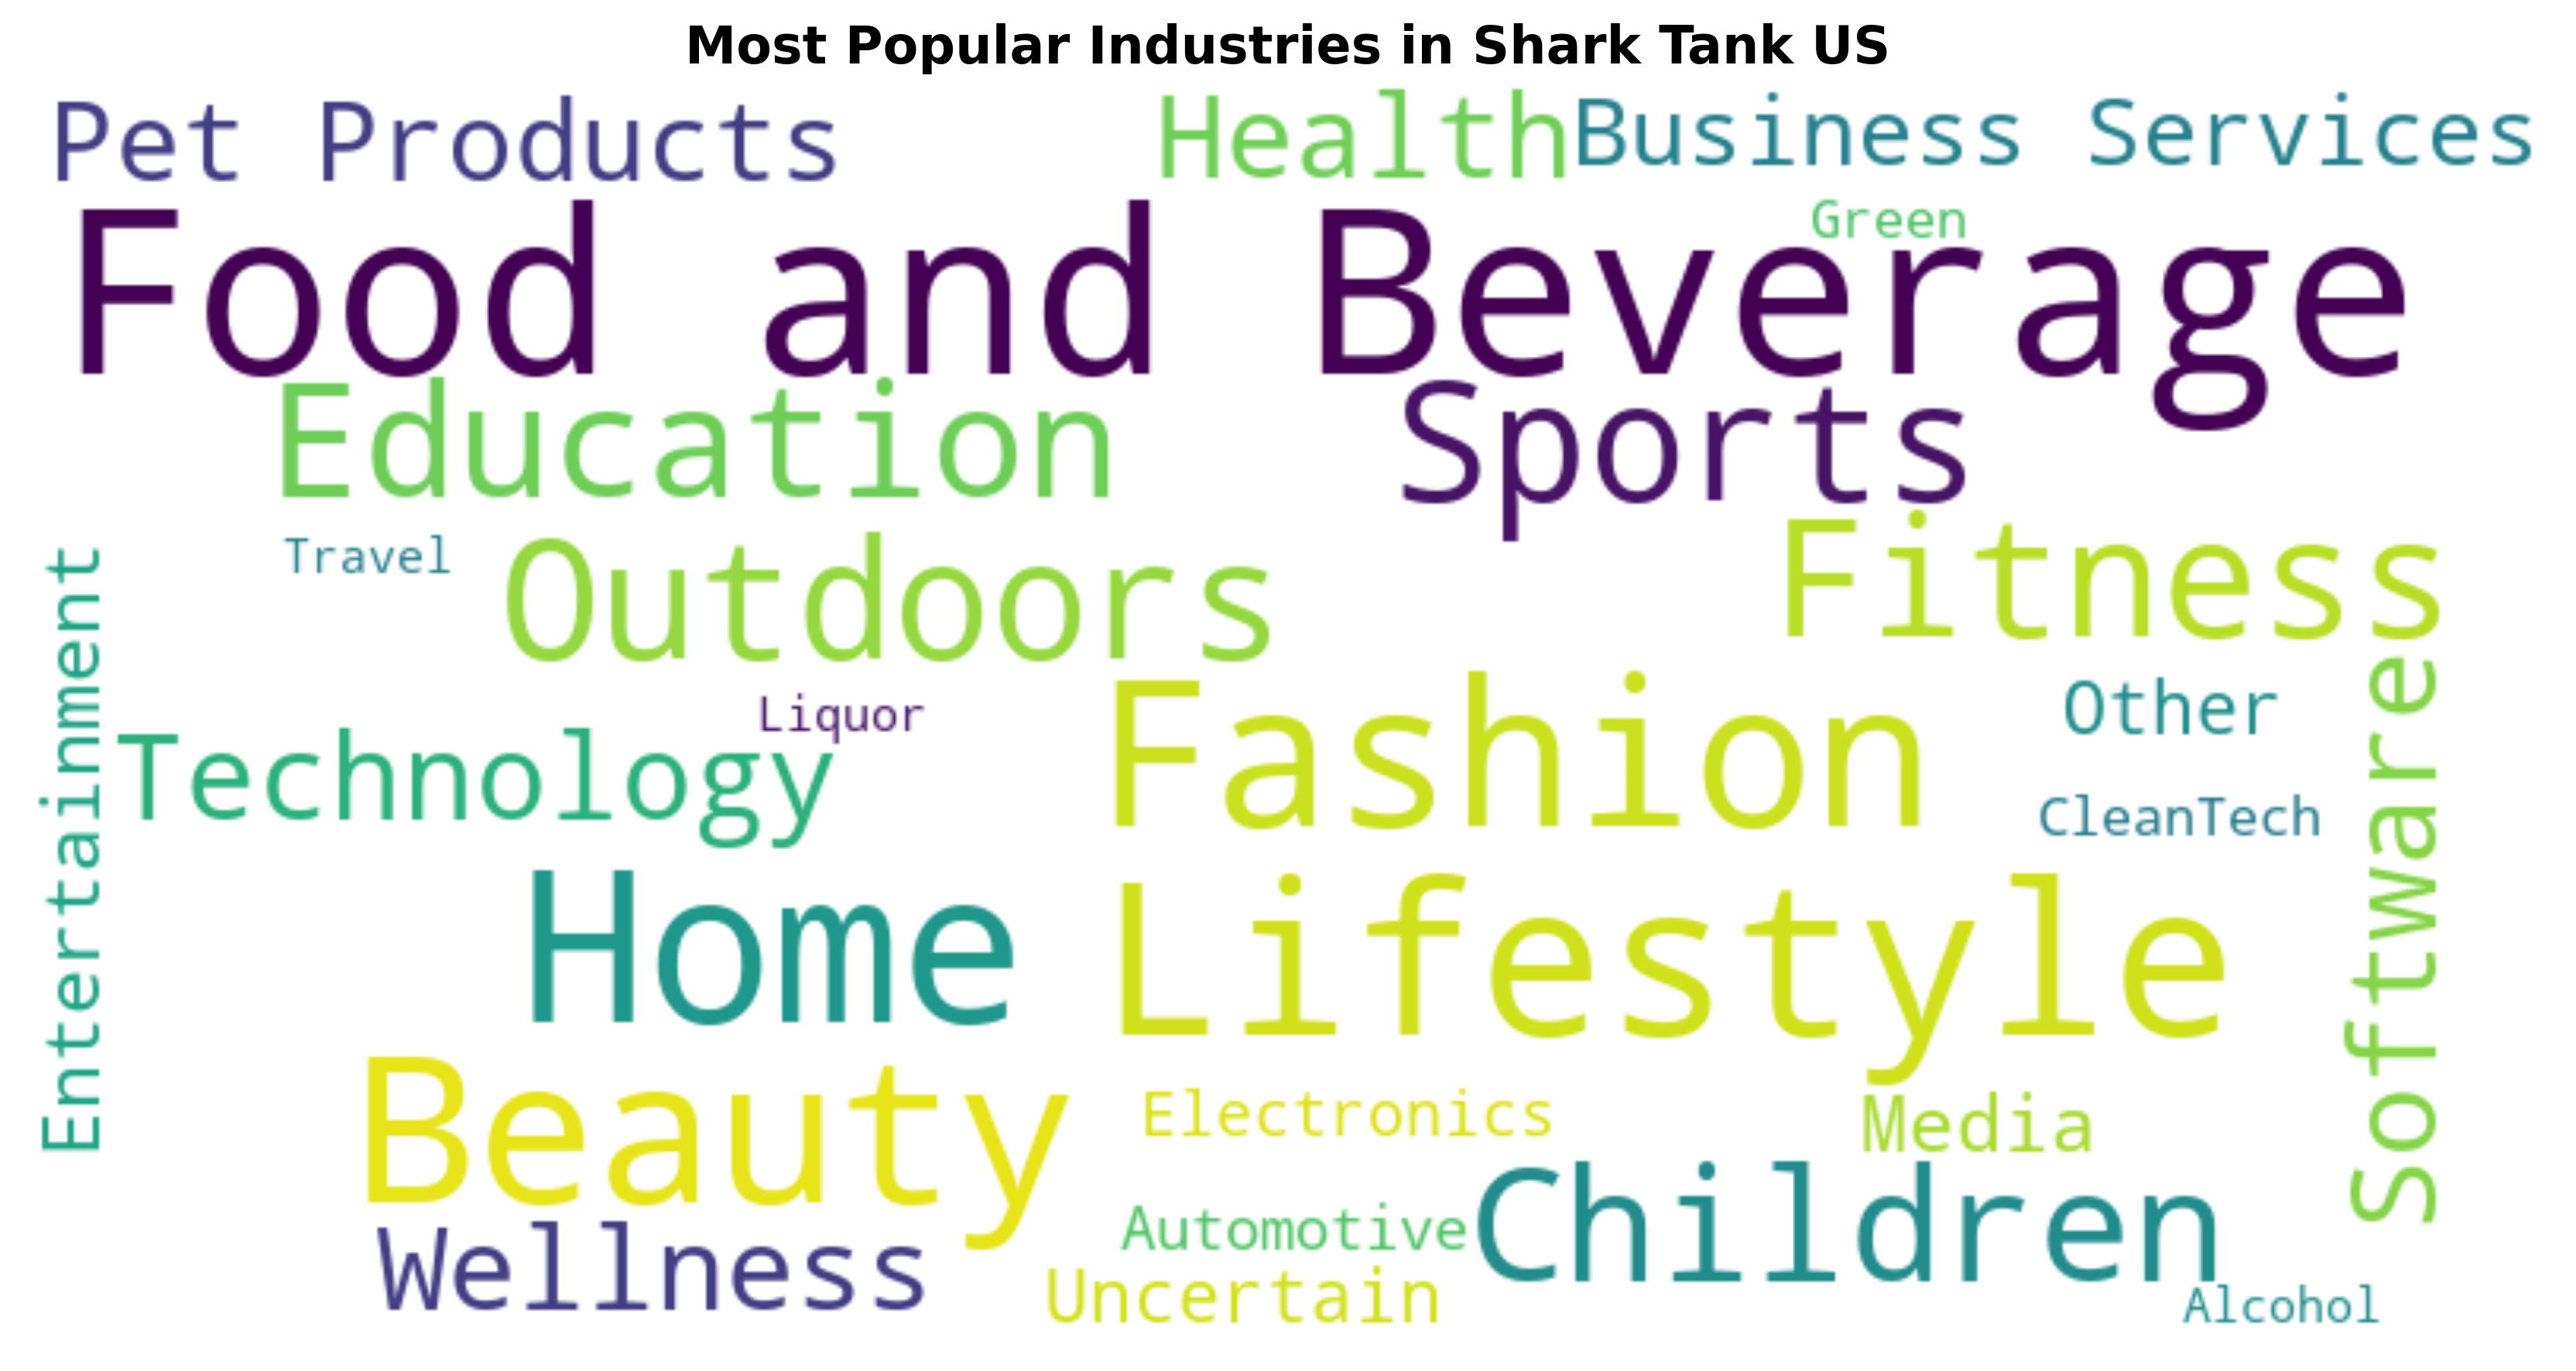
Key Insights:
- Food and Beverage dominates with 21.4% of all pitches
- Lifestyle/Home and Fashion/Beauty are runner-ups
- Technology/Software represents a smaller but significant portion
Deal Probability Heatmap (Success Rate by Ask × Valuation)
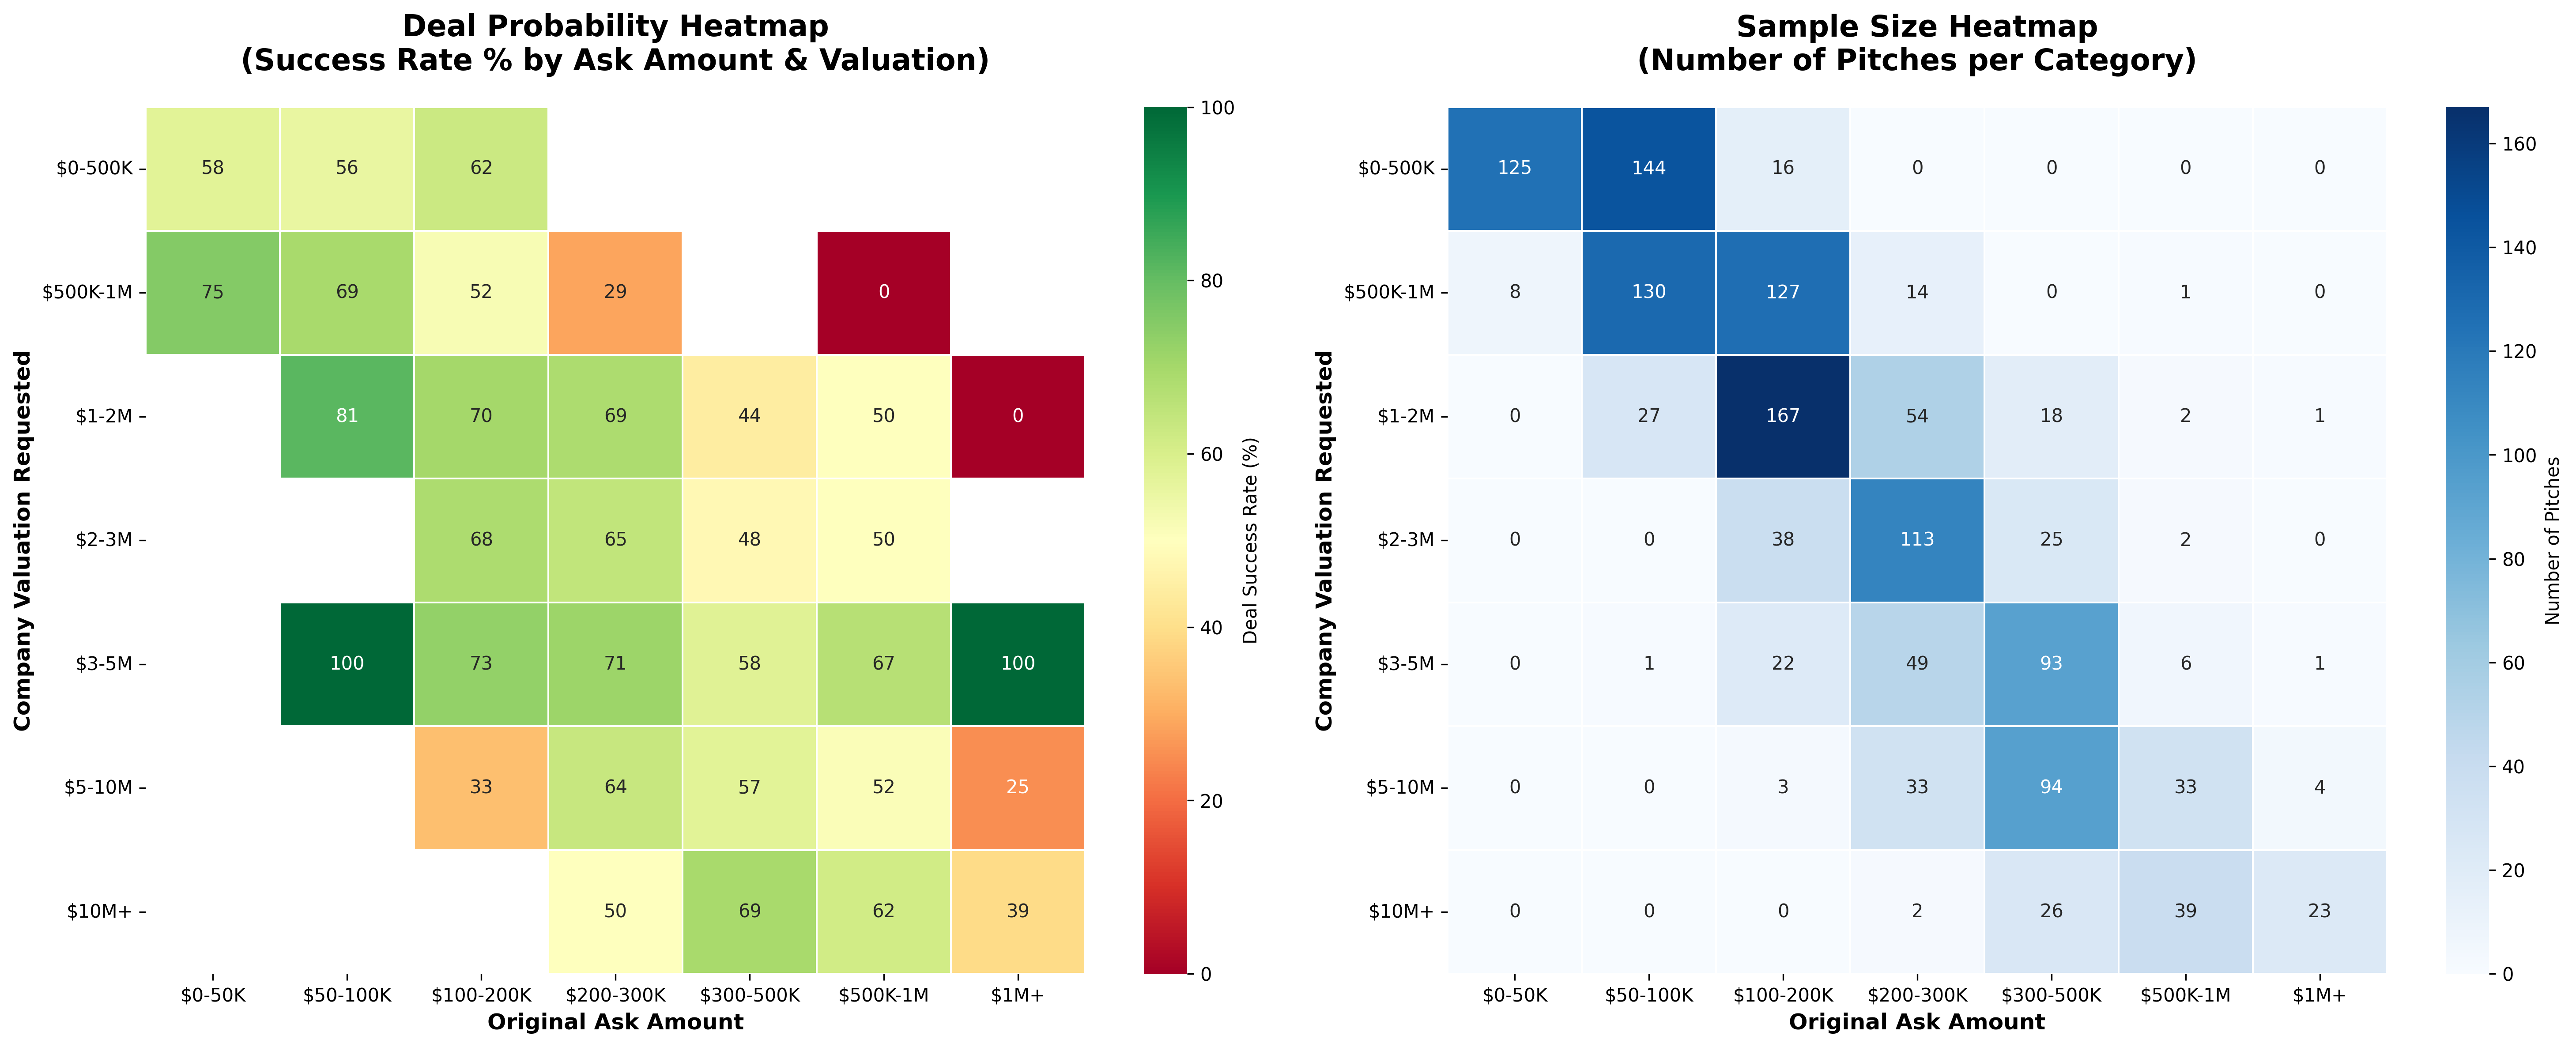
Key Insights:
- Sweet Spot: $1-2M valuation + $100-200K ask = 70% success
- No-Fly Zone: $500K-1M valuation + $200-300K ask = 28.6% success
- Extreme valuations ($10M+) face skepticism from sharks
Valuation Requested vs. Total Deal Amount
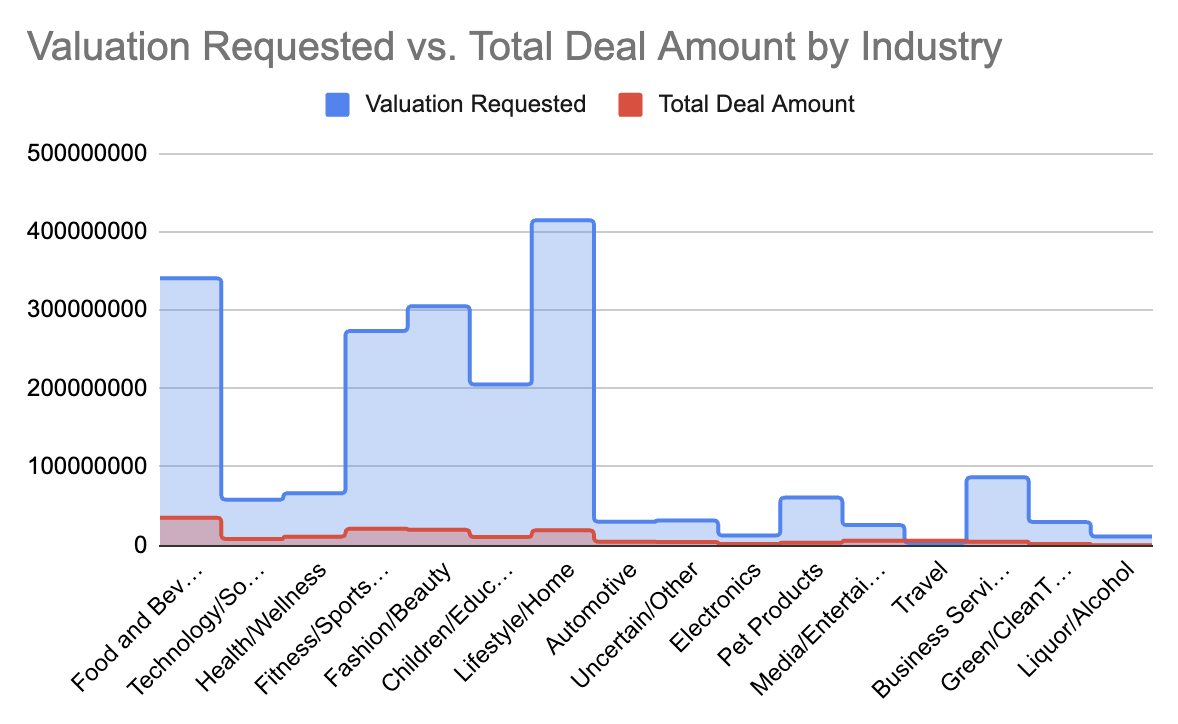
Key Insights:
- Negotiation Reality: 68% of deals close at lower valuations than originally requested
- Shark Leverage: Average valuation reduction is 32% from initial ask
- Deals above $5M valuation rarely close without significant equity concessions
Barbara / Mark / Lori – Investments by Industry
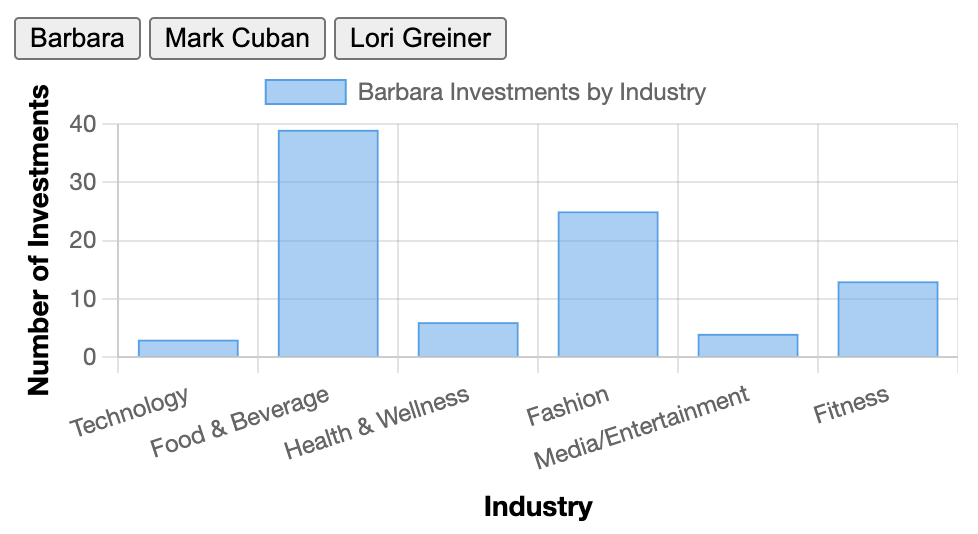
Key Insights:
- Capital Concentration: Food & Beverage receives 24% of total investment dollars
- High-Value Sectors: Technology/Software commands larger average deal sizes ($285K)
- Lifestyle/Home shows highest volume but moderate average investment ($165K)
Top 10 Industries by Total Invested Amount
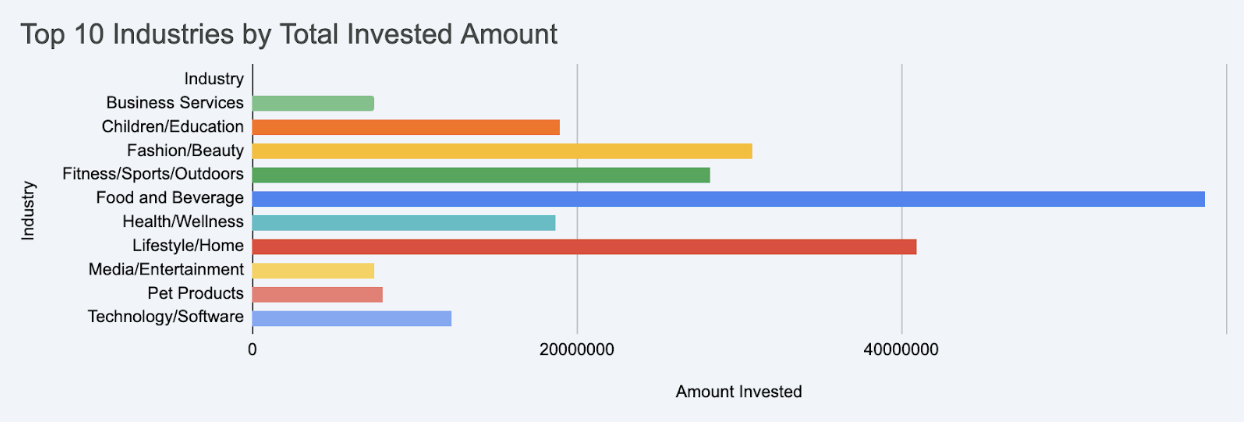
Key Insights:
- Pitch Volume Leader: Food & Beverage dominates with 309 pitches (21.4%)
- Consistent Performers: Top 5 industries remain stable across all 16 seasons
- Combined top 10 industries represent 82% of all Shark Tank pitches
Total Amount Invested by Each Shark
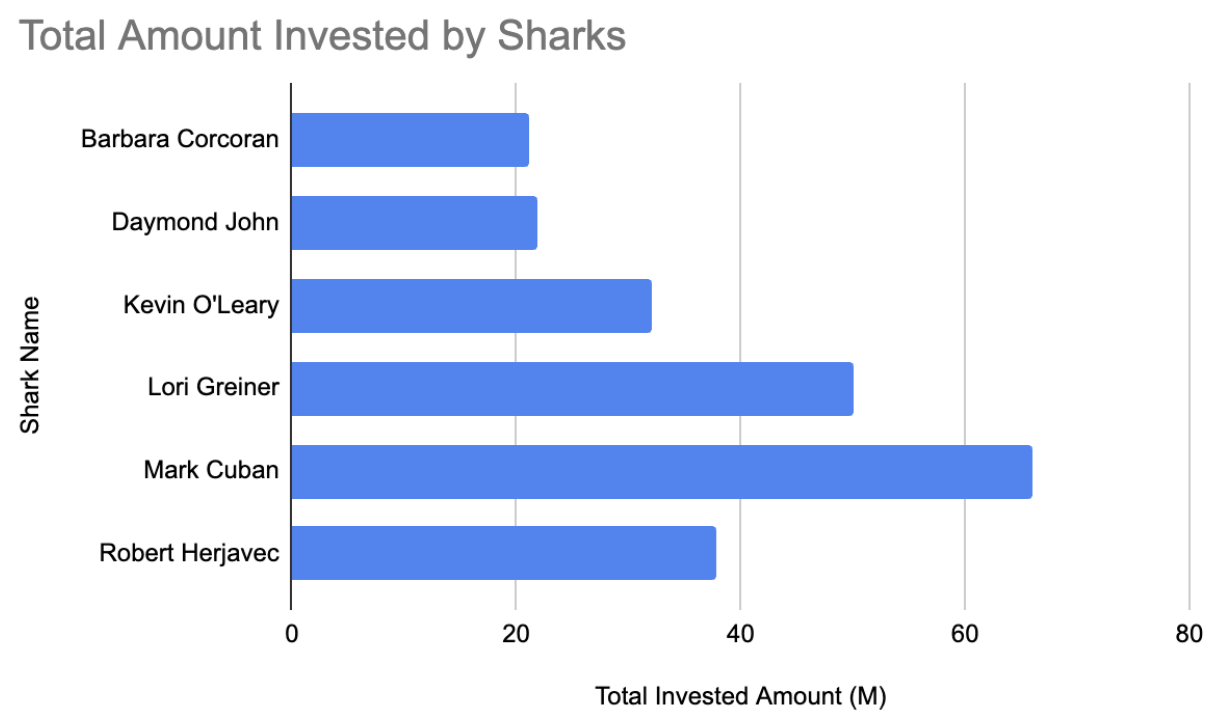
Key Insights:
- Top Investor: Mark Cuban leads with $18.2M total invested across 154 deals
- Selective Approach: Kevin O'Leary invests less frequently but larger amounts ($12.8M/89 deals)
- Lori Greiner specializes in consumer products with consistent $75K-150K deal sizes